Мониторинг с prometheus в kubernetes за 15 минут
Содержание:
Aggregation operators
Prometheus supports the following built-in aggregation operators that can be
used to aggregate the elements of a single instant vector, resulting in a new
vector of fewer elements with aggregated values:
- (calculate sum over dimensions)
- (select minimum over dimensions)
- (select maximum over dimensions)
- (calculate the average over dimensions)
- (all values in the resulting vector are 1)
- (calculate population standard deviation over dimensions)
- (calculate population standard variance over dimensions)
- (count number of elements in the vector)
- (count number of elements with the same value)
- (smallest k elements by sample value)
- (largest k elements by sample value)
- (calculate φ-quantile (0 ≤ φ ≤ 1) over dimensions)
These operators can either be used to aggregate over all label dimensions
or preserve distinct dimensions by including a or clause. These
clauses may be used before or after the expression.
or
is a list of unquoted labels that may include a trailing comma, i.e.
both and are valid syntax.
removes the listed labels from the result vector, while
all other labels are preserved the output. does the opposite and drops
labels that are not listed in the clause, even if their label values are
identical between all elements of the vector.
is only required for , , and
.
outputs one time series per unique sample value. Each series has
an additional label. The name of that label is given by the aggregation
parameter, and the label value is the unique sample value. The value of each
time series is the number of times that sample value was present.
and are different from other aggregators in that a subset of
the input samples, including the original labels, are returned in the result
vector. and are only used to bucket the input vector.
calculates the φ-quantile, the value that ranks at number φ*N among
the N metric values of the dimensions aggregated over. φ is provided as the
aggregation parameter. For example, calculates the median,
the 95th percentile.
Example:
If the metric had time series that fan out by
, , and labels, we could calculate the total
number of seen HTTP requests per application and group over all instances via:
Which is equivalent to:
If we are just interested in the total of HTTP requests we have seen in all
applications, we could simply write:
To count the number of binaries running each build version we could write:
To get the 5 largest HTTP requests counts across all instances we could write:
Configuring federation
On any given Prometheus server, the endpoint allows retrieving the
current value for a selected set of time series in that server. At least one
URL parameter must be specified to select the series to expose. Each
argument needs to specify an
like
or . If multiple parameters are provided,
the union of all matched series is selected.
To federate metrics from one server to another, configure your destination
Prometheus server to scrape from the endpoint of a source server,
while also enabling the scrape option (to not overwrite any
labels exposed by the source server) and passing in the desired
parameters. For example, the following federates any series
with the label or a metric name starting with from
the Prometheus servers at into the scraping
Prometheus:
This documentation is . Please help improve it by filing issues or pull requests.
_over_time()
The following functions allow aggregating each series of a given range vector
over time and return an instant vector with per-series aggregation results:
- : the average value of all points in the specified interval.
- : the minimum value of all points in the specified interval.
- : the maximum value of all points in the specified interval.
- : the sum of all values in the specified interval.
- : the count of all values in the specified interval.
- : the φ-quantile (0 ≤ φ ≤ 1) of the values in the specified interval.
- : the population standard deviation of the values in the specified interval.
- : the population standard variance of the values in the specified interval.
Note that all values in the specified interval have the same weight in the
aggregation even if the values are not equally spaced throughout the interval.
This documentation is . Please help improve it by filing issues or pull requests.
Подготовка сервера
Настроим некоторые параметры сервера, необходимые для правильно работы системы.
Время
Для отображения событий в правильное время, необходимо настроить его синхронизацию. Для этого установим chrony:
а) если на системе CentOS / Red Hat:
yum install chrony
systemctl enable chronyd
systemctl start chronyd
б) если на системе Ubuntu / Debian:
apt-get install chrony
systemctl enable chrony
systemctl start chrony
Брандмауэр
На фаерволе, при его использовании, необходимо открыть порты:
- TCP 9090 — http для сервера прометеус.
- TCP 9093 — http для алерт менеджера.
- TCP и UDP 9094 — для алерт менеджера.
- TCP 9100 — для node_exporter.
а) с помощью firewalld:
firewall-cmd —permanent —add-port=9090/tcp —add-port=9093/tcp —add-port=9094/{tcp,udp} —add-port=9100/tcp
firewall-cmd —reload
б) с помощью iptables:
iptables -I INPUT 1 -p tcp —match multiport —dports 9090,9093,9094,9100 -j ACCEPT
iptables -A INPUT -p udp —dport 9094 -j ACCEPT
в) с помощью ufw:
ufw allow 9090,9093,9094,9100/tcp
ufw allow 9094/udp
ufw reload
SELinux
По умолчанию, SELinux работает в операционный системах на базе Red Hat. Проверяем, работает ли она в нашей системе:
getenforce
Если мы получаем в ответ:
Enforcing
… необходимо отключить его командами:
setenforce 0
sed -i ‘s/^SELINUX=.*/SELINUX=disabled/g’ /etc/selinux/config
* если же мы получим ответ The program ‘getenforce’ is currently not installed, то SELinux не установлен в системе.
TSDB Admin APIs
These are APIs that expose database functionalities for the advanced user. These APIs are not enabled unless the is set.
We also expose a gRPC API whose definition can be found here. This is experimental and might change in the future.
Snapshot
Snapshot creates a snapshot of all current data into under the TSDB’s data directory and returns the directory as response.
It will optionally skip snapshotting data that is only present in the head block, and which has not yet been compacted to disk.
URL query parameters:
skip_head=: Skip data present in the head block. Optional.
The snapshot now exists at
New in v2.1 and supports PUT from v2.9
Delete Series
DeleteSeries deletes data for a selection of series in a time range. The actual data still exists on disk and is cleaned up in future compactions or can be explicitly cleaned up by hitting the Clean Tombstones endpoint.
If successful, a is returned.
URL query parameters:
- : Repeated label matcher argument that selects the series to delete. At least one argument must be provided.
- : Start timestamp. Optional and defaults to minimum possible time.
- : End timestamp. Optional and defaults to maximum possible time.
Not mentioning both start and end times would clear all the data for the matched series in the database.
Example:
New in v2.1 and supports PUT from v2.9
Clean Tombstones
CleanTombstones removes the deleted data from disk and cleans up the existing tombstones. This can be used after deleting series to free up space.
If successful, a is returned.
This takes no parameters or body.
New in v2.1 and supports PUT from v2.9
This documentation is . Please help improve it by filing issues or pull requests.
Querying metadata
Finding series by label matchers
The following endpoint returns the list of time series that match a certain label set.
URL query parameters:
-
: Repeated series selector argument that selects the
series to return. At least one argument must be provided. - : Start timestamp.
- : End timestamp.
You can URL-encode these parameters directly in the request body by using the method and
header. This is useful when specifying a large
or dynamic number of series selectors that may breach server-side URL character limits.
The section of the query result consists of a list of objects that
contain the label name/value pairs which identify each series.
The following example returns all series that match either of the selectors
or :
Getting label names
The following endpoint returns a list of label names:
URL query parameters:
- : Start timestamp. Optional.
- : End timestamp. Optional.
The section of the JSON response is a list of string label names.
Here is an example.
Querying label values
The following endpoint returns a list of label values for a provided label name:
URL query parameters:
- : Start timestamp. Optional.
- : End timestamp. Optional.
The section of the JSON response is a list of string label values.
This example queries for all label values for the label:
Getting started
Prometheus comes with an example set of consoles to get you going. These can be
found at on a running Prometheus and will
display Node Exporter consoles if Prometheus is scraping Node Exporters with a
label.
The example consoles have 5 parts:
- A navigation bar on top
- A menu on the left
- Time controls on the bottom
- The main content in the center, usually graphs
- A table on the right
The navigation bar is for links to other systems, such as other Prometheis
,
documentation, and whatever else makes sense to you. The menu is for navigation
inside the same Prometheus server, which is very useful to be able to quickly
open a console in another tab to correlate information. Both are configured in
.
The time controls allow changing of the duration and range of the graphs.
Console URLs can be shared and will show the same graphs for others.
The main content is usually graphs. There is a configurable JavaScript graphing
library provided that will handle requesting data from Prometheus, and rendering
it via Rickshaw.
Finally, the table on the right can be used to display statistics in a more
compact form than graphs.
Обзор
Основные особенности
Основу Prometheus составляет prometheus server, работающий автономно и сохраняющий все данные локально. Сервисы обнаруживаются автоматически, при помощи поиска и статических установок, подготовленных разработчиками. Такой подход очень упрощает развертывание. Для контроля одной системы не нужно разворачивать распределенную систему мониторинга, фактически достаточно установить сервер, и система мониторинга уже работает.
Все данные представлены в виде временных рядов. Метки времени имеют точность до миллисекунд, значения представлены c 64-битной точностью. Гибкий язык запросов позволяет выбрать и при необходимости сохранить отдельно любую информацию из полученного набора, строить на их основе графики или генерировать алерты. Кроме этого, сервер при помощи клиентских библиотек может получать информацию с систем, включающихся в сеть периодически.
Проект предоставляет клиентские библиотеки, написанные на Golang, Java, Python и Ruby, есть сторонние решения на bash, Nodejs, Haskell и С#/.NET. Для передачи данных между компонентами выбран HTTP.
Архитектура
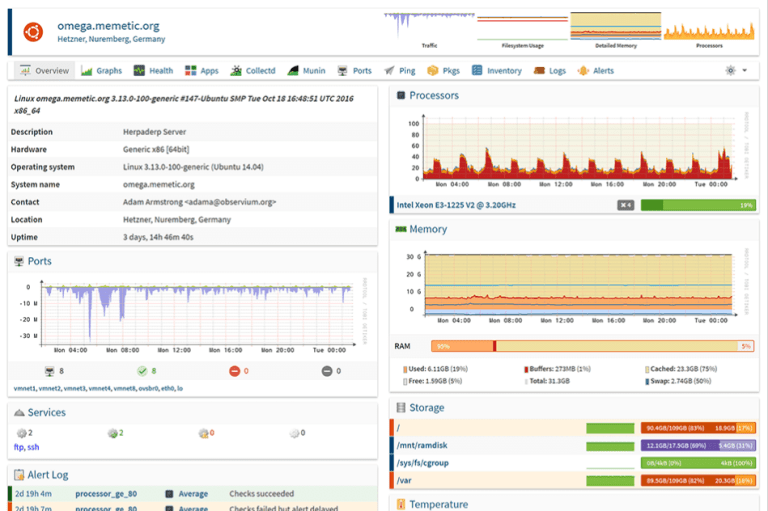
Prometheus имеет центральный компонент, называемый Prometheus Server. Его основная задача — хранить и мониторить определенные объекты. Объектом может стать что угодно: Linux-сервер, сервер Apache, один из процессов, сервер базы данных или любой другой компонент системы, который вы хотите контролировать. В терминах Prometheus главная служба мониторинга называется сервером Prometheus, а объекты мониторинга — целевыми объектами. Как я сказал ранее, целевым объектом может быть один сервер, или целевые объекты для проверки конечных точек через HTTP, HTTPS, DNS, TCP или простая конечная точка HTTP, которую выдает приложение. Через конечную точку HTTP сервер Prometheus проверяет статус приложения. Примерная архитектура представлена на рисунке 1.
Каждый элемент целевого объекта, который вы хотите мониторить (статус центрального процессора, память или любой другой элемент), называется метрикой. Таким образом, Prometheus собирает через HTTP метрики целевых объектов, хранит их локально или удаленно и отображает.
Сервер Prometheus считывает целевые объекты с интервалом, который вы определяете на сбор метрик, и хранит их в базе данных временных рядов. Целевые объекты и временной интервал считывания метрик вы задаете в конфигурационном файле prometheus.yml.
Рисунок 1 –– Одно из применений Prometheus
Вы запрашиваете у базы данных временных рядов Prometheus информацию о месте хранения метрик, используя язык запросов . Другими словами, с помощью PromQL вы просите сервер Prometheus показать статус конкретного целевого объекта в данный момент времени и получаете метрики.
Prometheus предоставляет клиентские библиотеки на нескольких языках, которые можно использовать для обеспечения работоспособности приложения. Но Prometheus — это не только мониторинг приложений.
Экспортеры
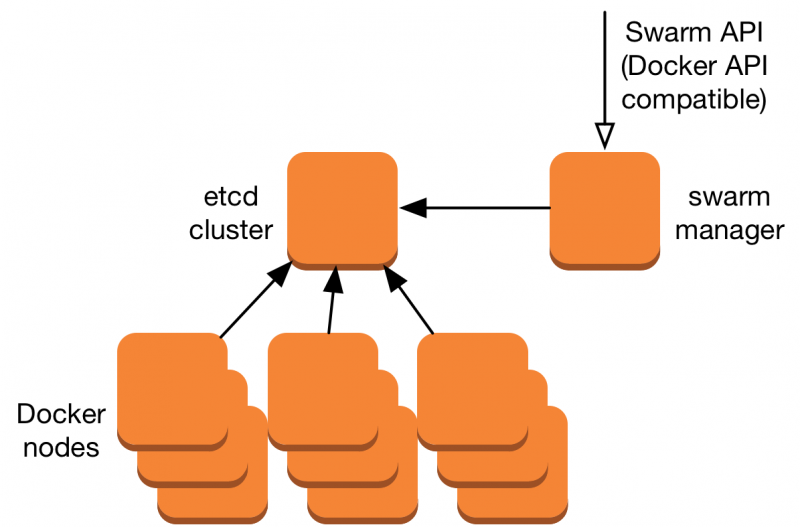
Рисунок 2 –– Применение экспортеров Prometheus
Вы можете использовать экспортеры для мониторинга сторонних систем (таких как сервер Linux, демон MySQL и т.д.). Экспортер — часть программного обеспечения, которое получает существующие метрики от сторонней системы и экспортирует их в формат, понятный серверу Prometheus. Одной из метрик с сервера Prometheus может быть текущее использование свободной памяти или файловой системы через Node Exporter на сервере Prometheus. Архитектура прометеуса с экспортерами приведена на рисунке 2.
Некоторые примеры экспортеров представлены ниже:
Управление оповещениями
Вы определяете правила оповещения в файле под названием alert.rules. Например, если сервер Prometheus найдет значение метрики, превышающее порог, который вы определили в файле alert.rules, Alert Manager разошлет оповещения. Как Alert Manager работает с Prometheus и как его установить в стеке Prometheus, я расскажу в следующем посте.
Производительность
На практике заявленная производительность подтверждается. При мониторинге 800 сервисов, около 80 метрик в каждом, Prometheus использует около 6% одного ядра и 3 GB RAM, а собранные за 15 дней метрики занимают 17 GB памяти на диске. Не обязательно выделять для Prometheus отдельный сервер, с таким незначительным потреблением ресурсов он может быть установлен рядом с другими сервисами, не принося никаких неудобств.
Time series Selectors
Instant vector selectors
Instant vector selectors allow the selection of a set of time series and a
single sample value for each at a given timestamp (instant): in the simplest
form, only a metric name is specified. This results in an instant vector
containing elements for all time series that have this metric name.
This example selects all time series that have the metric
name:
It is possible to filter these time series further by appending a comma separated list of label
matchers in curly braces ().
This example selects only those time series with the
metric name that also have the label set to and their
label set to :
It is also possible to negatively match a label value, or to match label values
against regular expressions. The following label matching operators exist:
- : Select labels that are exactly equal to the provided string.
- : Select labels that are not equal to the provided string.
- : Select labels that regex-match the provided string.
- : Select labels that do not regex-match the provided string.
For example, this selects all time series for ,
, and environments and HTTP methods other than .
Label matchers that match empty label values also select all time series that
do not have the specific label set at all. Regex-matches are fully anchored. It
is possible to have multiple matchers for the same label name.
Vector selectors must either specify a name or at least one label matcher
that does not match the empty string. The following expression is illegal:
In contrast, these expressions are valid as they both have a selector that does not
match empty label values.
Label matchers can also be applied to metric names by matching against the internal
label. For example, the expression is equivalent to
. Matchers other than (, , ) may also be used.
The following expression selects all metrics that have a name starting with :
The metric name must not be one of the keywords , , , and . The following expression is illegal:
A workaround for this restriction is to use the label:
All regular expressions in Prometheus use RE2
syntax.
Range Vector Selectors
Range vector literals work like instant vector literals, except that they
select a range of samples back from the current instant. Syntactically, a range
duration is appended in square brackets () at the end of a vector selector
to specify how far back in time values should be fetched for each resulting
range vector element.
Time durations are specified as a number, followed immediately by one of the
following units:
- — seconds
- — minutes
- — hours
- — days
- — weeks
- — years
In this example, we select all the values we have recorded within the last 5
minutes for all time series that have the metric name and
a label set to :
Offset modifier
The modifier allows changing the time offset for individual
instant and range vectors in a query.
For example, the following expression returns the value of
5 minutes in the past relative to the current
query evaluation time:
Note that the modifier always needs to follow the selector
immediately, i.e. the following would be correct:
While the following would be incorrect:
The same works for range vectors. This returns the 5-minute rate that
had a week ago:
Prometheus
Prometheus не устанавливается из репозитория и имеет, относительно, сложный процесс установки. Необходимо скачать исходник, создать пользователя, вручную скопировать нужные файлы, назначить права и создать юнит для автозапуска.
Загрузка
Переходим на официальную страницу загрузки и копируем ссылку на пакет для Linux:
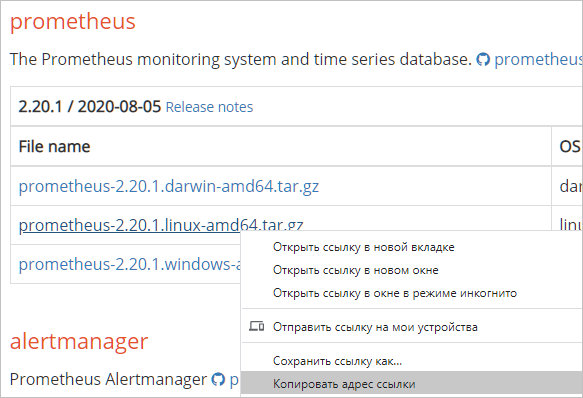
… и используем ее для загрузки пакета на Linux:
wget https://github.com/prometheus/prometheus/releases/download/v2.20.1/prometheus-2.20.1.linux-amd64.tar.gz
* если система вернет ошибку, необходимо установить пакет wget.
Установка (копирование файлов)
После того, как мы скачали архив prometheus, необходимо его распаковать и скопировать содержимое по разным каталогам.
Для начала создаем каталоги, в которые скопируем файлы для prometheus:
mkdir /etc/prometheus
mkdir /var/lib/prometheus
Распакуем наш архив:
tar zxvf prometheus-*.linux-amd64.tar.gz
… и перейдем в каталог с распакованными файлами:
cd prometheus-*.linux-amd64
Распределяем файлы по каталогам:
cp prometheus promtool /usr/local/bin/
cp -r console_libraries consoles prometheus.yml /etc/prometheus
Назначение прав
Создаем пользователя, от которого будем запускать систему мониторинга:
useradd —no-create-home —shell /bin/false prometheus
* мы создали пользователя prometheus без домашней директории и без возможности входа в консоль сервера.
Задаем владельца для каталогов, которые мы создали на предыдущем шаге:
chown -R prometheus:prometheus /etc/prometheus /var/lib/prometheus
Задаем владельца для скопированных файлов:
chown prometheus:prometheus /usr/local/bin/{prometheus,promtool}
Запуск и проверка
Запускаем prometheus командой:
/usr/local/bin/prometheus —config.file /etc/prometheus/prometheus.yml —storage.tsdb.path /var/lib/prometheus/ —web.console.templates=/etc/prometheus/consoles —web.console.libraries=/etc/prometheus/console_libraries
… мы увидим лог запуска — в конце «Server is ready to receive web requests»:
level=info ts=2019-08-07T07:39:06.849Z caller=main.go:621 msg=»Server is ready to receive web requests.»
Открываем веб-браузер и переходим по адресу http://<IP-адрес сервера>:9090 — загрузится консоль Prometheus:
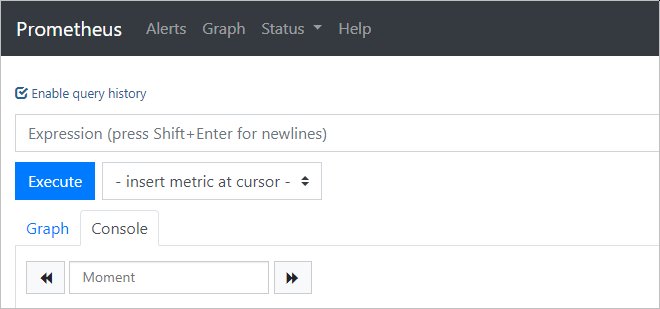
Установка завершена.
Автозапуск
Мы установили наш сервер мониторинга, но его необходимо запускать вручную, что совсем не подходит для серверных задач. Для настройки автоматического старта Prometheus мы создадим новый юнит в systemd.
Возвращаемся к консоли сервера и прерываем работу Prometheus с помощью комбинации Ctrl + C. Создаем файл prometheus.service:
vi /etc/systemd/system/prometheus.service
Description=Prometheus Service
After=network.target
User=prometheus
Group=prometheus
Type=simple
ExecStart=/usr/local/bin/prometheus \
—config.file /etc/prometheus/prometheus.yml \
—storage.tsdb.path /var/lib/prometheus/ \
—web.console.templates=/etc/prometheus/consoles \
—web.console.libraries=/etc/prometheus/console_libraries
ExecReload=/bin/kill -HUP $MAINPID
Restart=on-failure
WantedBy=multi-user.target
Перечитываем конфигурацию systemd:
systemctl daemon-reload
Разрешаем автозапуск:
systemctl enable prometheus
После ручного запуска мониторинга, который мы делали для проверки, могли сбиться права на папку библиотек — снова зададим ей владельца:
chown -R prometheus:prometheus /var/lib/prometheus
Запускаем службу:
systemctl start prometheus
… и проверяем, что она запустилась корректно:
systemctl status prometheus
Use cases
There are different use cases for federation. Commonly, it is used to either
achieve scalable Prometheus monitoring setups or to pull related metrics from
one service’s Prometheus into another.
Hierarchical federation
Hierarchical federation allows Prometheus to scale to environments with tens of
data centers and millions of nodes. In this use case, the federation topology
resembles a tree, with higher-level Prometheus servers collecting aggregated
time series data from a larger number of subordinated servers.
For example, a setup might consist of many per-datacenter Prometheus servers
that collect data in high detail (instance-level drill-down), and a set of
global Prometheus servers which collect and store only aggregated data
(job-level drill-down) from those local servers. This provides an aggregate
global view and detailed local views.
Cross-service federation
In cross-service federation, a Prometheus server of one service is configured
to scrape selected data from another service’s Prometheus server to enable
alerting and queries against both datasets within a single server.
For example, a cluster scheduler running multiple services might expose
resource usage information (like memory and CPU usage) about service instances
running on the cluster. On the other hand, a service running on that cluster
will only expose application-specific service metrics. Often, these two sets of
metrics are scraped by separate Prometheus servers. Using federation, the
Prometheus server containing service-level metrics may pull in the cluster
resource usage metrics about its specific service from the cluster Prometheus,
so that both sets of metrics can be used within that server.
Мониторинг служб Linux
Для мониторинга сервисов с помощью Prometheus мы настроим сбор метрик и отображение тревог.
Сбор метрие с помощью node_exporter
Открываем сервис, созданный для node_exporter:
vi /etc/systemd/system/node_exporter.service
… и добавим к ExecStart:
…
ExecStart=/usr/local/bin/node_exporter —collector.systemd
…
* данная опция указывает экспортеру мониторить состояние каждой службы.
При необходимости, мы можем либо мониторить отдельные службы, добавив опцию collector.systemd.unit-whitelist:
ExecStart=/usr/local/bin/node_exporter —collector.systemd —collector.systemd.unit-whitelist=»(chronyd|mariadb|nginx).service»
* в данном примере будут мониториться только сервисы chronyd, mariadb и nginx.
… либо наоборот — мониторить все службы, кроме отдельно взятых:
ExecStart=/usr/local/bin/node_exporter —collector.systemd —collector.systemd.unit-blacklist=»(auditd|dbus|kdump).service»
* при такой настройке мы запретим мониторинг сервисов auditd, dbus и kdump.
Чтобы применить настройки, перечитываем конфиг systemd:
systemctl daemon-reload
Перезапускаем node_exporter:
systemctl restart node_exporter
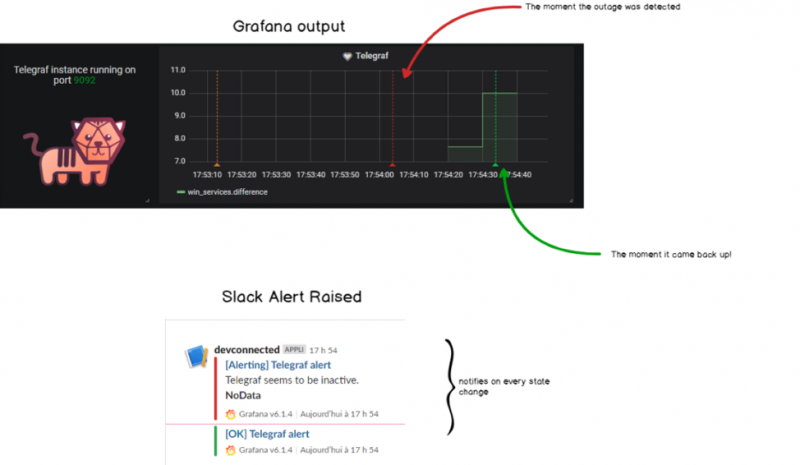
Отображение тревог
Настроим мониторинг для службы NGINX.
Создаем файл с правилом:
vi /etc/prometheus/services.rules.yml
groups:
— name: services.rules
rules:
— alert: nginx_service
expr: node_systemd_unit_state{name=»nginx.service»,state=»active»} == 0
for: 1s
annotations:
summary: «Instance {{ $labels.instance }} is down»
description: «{{ $labels.instance }} of job {{ $labels.job }} is down.»
Подключим файл с описанием правил в конфигурационном файле prometheus:
vi /etc/prometheus/prometheus.yml
…
rule_files:
# — «first_rules.yml»
# — «second_rules.yml»
— «alert.rules.yml»
— «services.rules.yml»
…
* в данном примере мы добавили наш файл services.rules.yml к уже ранее добавленному alert.rules.yml в секцию rule_files.
Перезапускаем prometheus:
systemctl restart prometheus
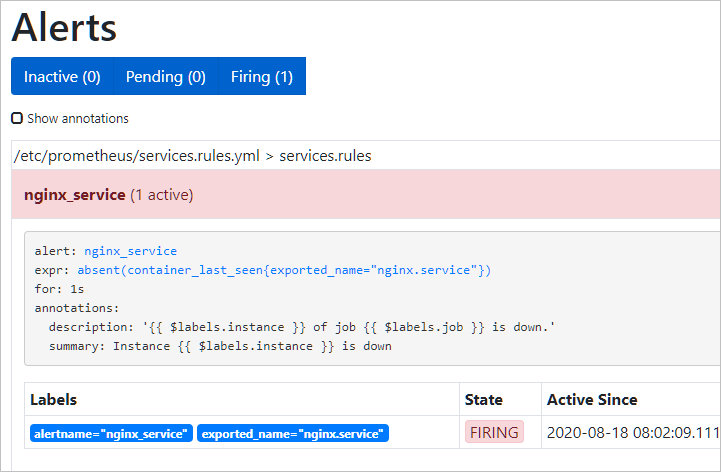
Для проверки, остановим наш сервис:
systemctl stop nginx
В консоли Prometheus в разделе Alerts мы должны увидеть тревогу:
Authentication, Authorization, and Encryption
In the future, server-side TLS support will be rolled out to the different
Prometheus projects. Those projects include Prometheus, Alertmanager,
Pushgateway and the official exporters.
Authentication of clients by TLS client certs will also be supported.
The Go projects will share the same TLS library, which will be based on the
Go vanilla crypto/tls library.
We default to TLS 1.2 as minimum version. Our policy regarding this is based on
Qualys SSL Labs recommendations, where we strive to
achieve a grade ‘A’ with a default configuration and correctly provided
certificates, while sticking as closely as possible to the upstream Go defaults.
Achieving that grade provides a balance between perfect security and usability.
TLS will be added to Java exporters in the future.
If you have special TLS needs, like a different cipher suite or older TLS
version, you can tune the minimum TLS version and the ciphers, as long as the
cipher is not
in the crypto/tls library. If that still
does not suit you, the current TLS settings enable you to build a secure tunnel
between the servers and reverse proxies with more special requirements.
HTTP Basic Authentication will also be supported. Basic Authentication can be
used without TLS, but it will then expose usernames and passwords in cleartext
over the network.
On the server side, basic authentication passwords are stored as hashes with the
bcrypt algorithm. It is your
responsibility to pick the number of rounds that matches your security
standards. More rounds make brute-force more complicated at the cost of more CPU
power and more time to authenticate the requests.
Various Prometheus components support client-side authentication and
encryption. If TLS client support is offered, there is often also an option
called which skips SSL verification.
histogram_quantile()
calculates the φ-quantile (0 ≤ φ
≤ 1) from the buckets of a
. (See
histograms and summaries for
a detailed explanation of φ-quantiles and the usage of the histogram metric type
in general.) The samples in are the counts of observations in each bucket.
Each sample must have a label where the label value denotes the inclusive
upper bound of the bucket. (Samples without such a label are silently ignored.)
The
automatically provides time series with the suffix and the appropriate
labels.
Use the function to specify the time window for the quantile
calculation.
Example: A histogram metric is called . To
calculate the 90th percentile of request durations over the last 10m, use the
following expression:
The quantile is calculated for each label combination in
. To aggregate, use the aggregator
around the function. Since the label is required by
, it has to be included in the clause. The following
expression aggregates the 90th percentile by :
To aggregate everything, specify only the label:
The function interpolates quantile values by
assuming a linear distribution within a bucket. The highest bucket
must have an upper bound of . (Otherwise, is returned.) If
a quantile is located in the highest bucket, the upper bound of the
second highest bucket is returned. A lower limit of the lowest bucket
is assumed to be 0 if the upper bound of that bucket is greater than
0. In that case, the usual linear interpolation is applied within that
bucket. Otherwise, the upper bound of the lowest bucket is returned
for quantiles located in the lowest bucket.
If has 0 observations, is returned. If contains fewer than two buckets,
is returned. For φ < 0, is returned. For φ > 1, is returned.