Собираем, парсим и отдаём логи с помощью logstash
Содержание:
Кратко про конфигурационные файлы
- Networks и volumes были взяты из исходного docker-compose.yml (тот где целиком стек запускается) и думаю, что сильно здесь на общую картинку не влияют.
- Мы создаём один сервис (services) logstash, из образа docker.elastic.co/logstash/logstash:6.3.2 и присваиваем ему имя logstash_one_channel.
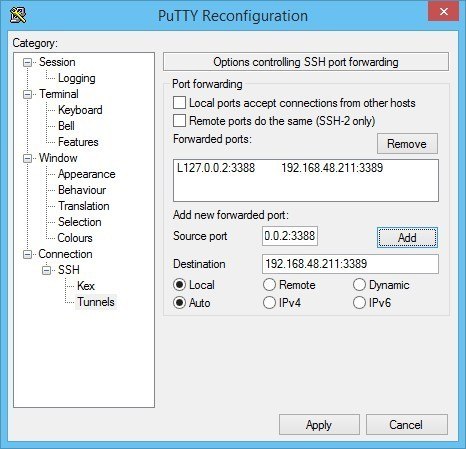
- Мы пробрасываем внутрь контейнера порт 5046, на такой же внутренний порт.
- Мы отображаем наш файл настройки каналов ./config/pipelines.yml на файл /usr/share/logstash/config/pipelines.yml внутри контейнера, откуда его подхватит logstash и делаем его read-only, просто на всякий случай.
- Мы отображаем директорию ./config/pipelines, где у нас лежат файлы с настройками каналов, в директорию /usr/share/logstash/config/pipelines и тоже делаем её read-only.
logstash_one_channel | Unable to retrieve license information from license server {:message=>«Elasticsearch Unreachable: [http://elasticsearch:9200/]logstash_one_channel | Pipeline started successfully logstash_one_channel | logstash_one_channel | X-Pack is installed on Logstash but not on Elasticsearch. Please install X-Pack on Elasticsearch to use the monitoring feature. Other features may be available.logstash_one_channel | logstash_one_channel | ogstash_one_channel | Attempted to resurrect connection to dead ES instance, but got an error. {:url=>«elasticsearch:9200/», :error_type=>LogStash::Outputs::ElasticSearch::HttpClient::Pool::HostUnreachableError, :error=>«Elasticsearch Unreachable: [http://elasticsearch:9200/] elasticsearch»}logstash_one_channel | logstash_one_channel | Attempted to resurrect connection to dead ES instance, but got an error. {:url=>«elasticsearch:9200/», :error_type=>LogStash::Outputs::ElasticSearch::HttpClient::Pool::HostUnreachableError, :error=>«Elasticsearch Unreachable: [http://elasticsearch:9200/] elasticsearch»}elasticsearch
Логирование запросов
Логирования запросов в структурированном виде и сбор статистики отсутствовали, поэтому было непонятно, какие методы чаще всего вызываются и сколько по времени отвечают. Это привело к тому, что мы не могли:
- оценить допустимое время ответа методов.
- причину возникновения тормозов — на нашей стороне или на стороне внешнего сервиса (помните схему со звёздным небом?)
- как можно оптимизировать наш код, чтобы уменьшить время ответа.
В рамках данной задачи нам предстояло решить вопросы:
- выбор параметров ответа для логирования
- отправка параметров в Logstash
Мы используем веб-сервер Nginx, и он умеет писать access-логи в файл. Для решения первой задачи указали новый формат сохранения логов в конфигурации:
Большинство метрик, думаю, вопросов не вызывает, расскажу подробнее про наиболее интересную — $request_id. Это уникальный идентификатор, UUID версии 4, который генерируется Nginx для каждого запроса. Данный заголовок мы пробрасываем в запросе во внешние сервисы и можем отследить ответ запроса в логах других сервисах. Очень удобно при поиске проблем в других сервисах — никаких сравнений по времени, урлу вызванного метода.
Для отправки логов в Logstash используем утилиту Beaver. Устанавливается на все ноды приложения, с которых планируется отправка логов. В конфигурации указывается файл, который будет парситься для получения новых логов, указываются поля, которые будут отправляться с каждым сообщением. Сообщения отправляются в Redis-кластер, из которого Logstash забирает данные. Вот наша конфигурация Beaver:
По полям type и tags в Logstash по нашим значениям сделана фильтрация и обработка логов, у вас эти значения могут быть свои. Кроме того, добавляем поля team и project, чтобы можно было идентифицировать команду и проект, которым принадлежат логи.
Научившись собирать access-логи, мы перешли к определению SLA методов. SLA, договор на уровень оказания услуг, в нашем случае мы гарантируем, что 95-ый перцентиль по времени ответа методов будет не более 0.4 секунд. Если не укладываемся в допустимое время, то значит, что в приложении либо одна из интеграций тормозит и обращаемся к связанной команде, либо что-то не так в нашем коде и необходима оптимизация.
Вывод по сбору access-логов — мы определили наиболее часто вызываемые методы и их допустимое время ответа.
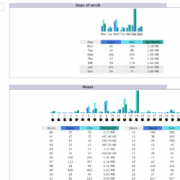
Вот примеры наших отчётов на одном из измеряемых методов. Первый — чему равны 50, 95 и 99 перцентили времени ответа и среднее время ответа:
Диаграмма статусов ответа:
Среднее время ответа за промежуток времени:
Health issues
Brainworm (Parelaphostrongylus tenuis) is a parasitic nematode that has been known to affect the spinal cord and brain tissue of elk, leading to death. The nematode has a carrier in the white-tailed deer in which it normally has no ill effects. Nonetheless, it is carried by snails, which can be inadvertently consumed by elk during grazing (Fergus 2007).
Chronic Wasting Disease affects the brain tissue in elk and has been detected throughout their range in North America. First documented in the late 1960s in mule deer, the disease has affected elk on game farms and in the wild in a number of regions. Elk that have contracted the disease begin to show weight loss, increased watering needs, disorientation and listlessness, and at an advanced stage the disease leads to death. The disease is similar to but not the same as Mad Cow Disease, and no dangers to humans have been documented, nor has the disease been demonstrated to pose a threat to domesticated cattle (RMEF 2007d). In 2002, South Korea banned the importation of elk antler velvet due to concerns about chronic wasting disease (Hansen 2006).
Brucellosis occasionally affect elk in the Greater Yellowstone Ecosystem, the only place in the U.S. where the disease is still known to exist. In domesticated cattle, brucellosis causes infertility, abortions, and reduced milk production. It is transmitted to humans as undulant fever, producing flu-like symptoms that may last for years. Though bison are more likely to transmit the disease to other animals, elk inadvertently transmitted brucellosis to horses in Wyoming and cattle in Idaho. Researchers are attempting to eradicate the disease through vaccinations and herd management measures, which are expected to be successful (USDA 2007).
What is the ELK Stack?
The ELK Stack is a collection of three open-source products — Elasticsearch, Logstash, and Kibana. They are all developed, managed ,and maintained by the company Elastic.
- E stands for ElasticSearch: used for storing logs
- L stands for LogStash : used for both shipping as well as processing and storing logs
- K stands for Kibana: is a visutalization tool (a web interface) which is hosted through Nginx or Apache
ELK Stack is designed to allow users to take to data from any source, in any format, and to search, analyze, and visualize that data in real time.
ELK provides centralized logging that be useful when attempting to identify problems with servers or applications. It allows you to search all your logs in a single place. It also helps to find issues that occur in multiple servers by connecting their logs during a specific time frame.
In this tutorial, you will learn
Cultural references
Elk have played an important role in the cultural history of a number of peoples.
Pictograms and petroglyphs of elk were carved into cliffs thousands of years ago by the Anasazi of the southwestern United States. More recent Native American tribes, including the Kootenai, Cree, Ojibwa, and Pawnee, produced blankets and robes from elk hides.
The elk was of particular importance to the Lakota and played a spiritual role in their society (RMEF 2007e). At birth, Lakota males were given an elk’s tooth to promote a long life since that was seen as the last part of dead elk to rot away. The elk was seen as having strong sexual potency and young Lakota males who had dreamed of elk would have an image of the mythical representation of the elk on their «courting coats» as a sign of sexual prowess. The Lakota believed that the mythical or spiritual elk, not the physical one, was the teacher of men and the embodiment of strength, sexual prowess, and courage (Halder 2002).
Neolithic petroglyphs from Asia depict antler-less female elk, which have been interpreted as symbolizing rebirth and sustenance. By the beginning of the Bronze Age, the elk is depicted less frequently in rock art, coinciding with a cultural transformation away from hunting (Jacobson 1993).
Naming and etymology
While the term «elk» refers to Cervus canadensis in North America, the term elk refers to Alces alces in English-speaking Europe, a deer that is known as «moose» in North America. The American Indian «waapiti,» meaning «white rump» and used by the Shawnees for this animal, has come to be a word, as «wapiti,» that can more clearly distinguish Cervus canadensis.
Early European explorers to North America, who were familiar with the smaller red deer of Europe, believed that the much larger North American animal looked more like a moose, hence they used the common European name for the moose. The name elk is from the German word for moose, which is elch (PEH 2007).
The elk is also referred to as the maral in Asia, though this is due to confusion with the central Asian red deer, which is a very similar species.
What is Elasticsearch?
Elasticsearch is a NoSQL database. It is based on Lucene search engine, and it is built with RESTful APIS. It offers simple deployment, maximum reliability, and easy management. It also offers advanced queries to perform detail analysis and stores all the data centrally. It is helpful for executing a quick search of the documents.
Elasticsearch also allows you to store, search and analyze big volume of data. It is mostly used as the underlying engine to powers applications that completed search requirements. It has been adopted in search engine platforms for modern web and mobile applications. Apart from a quick search, the tool also offers complex analytics and many advanced features.
Features of Elastic search:
- Open source search server is written using Java
- Used to index any kind of heterogeneous data
- Has REST API web-interface with JSON output
- Full-Text Search
- Near Real Time (NRT) search
- Sharded, replicated searchable, JSON document store
- Schema-free, REST & JSON based distributed document store
- Multi-language & Geolocation support
Advantages of Elasticsearch
- Store schema-less data and also creates a schema for your data
- Manipulate your data record by record with the help of Multi-document APIs
- Perform filtering and querying your data for insights
- Based on Apache Lucene and provides RESTful API
- Provides horizontal scalability, reliability, and multitenant capability for real time use of indexing to make it faster search
- Helps you to scale vertically and horizontally
Important Terms used in Elastic Search
| Term | Usage |
| Cluster | A cluster is a collection of nodes which together holds data and provides joined indexing and search capabilities. |
| Node | A node is an elasticsearch Instance. It is created when an elasticsearch instance begins. |
| Index | An index is a collection of documents which has similar characteristics. e.g., customer data, product catalog. It is very useful while performing indexing, search, update, and delete operations. It allows you to define as many indexes in one single cluster. |
| Document | It is the basic unit of information which can be indexed. It is expressed in JSON (key: value) pair. ‘{«user»: «nullcon»}’. Every single Document is associated with a type and a unique id. |
| Shard | Every index can be split into several shards to be able to distribute data. The shard is the atomic part of an index, which can be distributed over the cluster if you want to add more nodes. |
ELK Stack Architecture
Here is the simple architecture of ELK stack

- Logs: Server logs that need to be analyzed are identified
- Logstash: Collect logs and events data. It even parses and transforms data
- ElasticSearch: The transformed data from Logstash is Store, Search, and indexed.
- Kibana: Kibana uses Elasticsearch DB to Explore, Visualize, and Share
However, one more component is needed or Data collection called Beats. This led Elastic to rename ELK as the Elastic Stack.

While dealing with very large amounts of data, you may need Kafka, RabbitMQ for buffering and resilience. For security, nginx can be used.

Let’s deep drive all of these open source products:
Заключение
Получилась простая статья по сбору логов. Для тех, кто уже работал с ELK Stack тут ничего нового нет. По сути, никакого анализа и графиков нет, а именно это чаще всего интересует при использовании elk. Я просто не придумал, что может быть полезного в логах микротика, что требует какого-то детального разбора и построения дашбордов. Если у кого-то есть идеи или примеры grok фильтров, прошу поделиться.
Напоминаю, что данная статья является частью единого цикла статьей про Mikrotik.
Онлайн курсы по Mikrotik
Если у вас есть желание научиться работать с роутерами микротик и стать специалистом в этой области, рекомендую пройти курсы по программе, основанной на информации из официального курса MikroTik Certified Network Associate. Помимо официальной программы, в курсах будут лабораторные работы, в которых вы на практике сможете проверить и закрепить полученные знания. Все подробности на сайте .
Стоимость обучения весьма демократична, хорошая возможность получить новые знания в актуальной на сегодняшний день предметной области. Особенности курсов:
- Знания, ориентированные на практику;
- Реальные ситуации и задачи;
- Лучшее из международных программ.